

” or “Access denied”")


 Learning Guide")


 in SharePoint Online Modern Pages")


This article will talk about how to start using JMeter for Testing an API.
How to install JMeter, what are the components of it and how to use it. It will, also, show a short introduction of what is performance testing.
First of all, let’s talk about Performance Testing. What is Performance Testing?
Performance Testing is a software testing process used for testing the speed, response time, stability, reliability, scalability and resource usage of a software application under a particular workload.
The focus of Performance Testing is checking a software program’s
- Speed – Determines whether the application responds quickly
- Scalability – Determines the maximum user load the software application can handle.
- Stability – Determines if the application is stable under varying loads
What is the Purpose of doing it?
The main purpose of performance testing is to identify and eliminate the performance bottlenecks in the software application.
Now let’s introduce JMeter
How to install it?
JMeter is an application base in java. This means, that every computer with java installed can run this application. So let’s see how to install it.
1- Download Java.
First of all, you will need to install Java on your computer. Here you can download and Install the latest version of Java SE Development Kit https://www.oracle.com/java/technologies/javase-downloads.html.
2- Download JMeter.
At the point of writing, the latest version is Apache JMeter 5.4.1 (Requires Java 8+) and you can download it here http://jmeter.apache.org/download_jmeter.cgi. Choose the Binaries file (either apache-jmeter-5.4.1.zip or apache-jmeter-5.4.1.tgz).
3- Installation.
Installing Jmeter is easy! You only need to unzip the file to a directory of your choice and that’s it!
4- Start JMeter
JMeter can be used in 3 modes. These 3 modes are:
- GUI Mode
- Server Mode
- Command Line Mode
In this article, we will focus on GUI Mode. So, to start the GUI Mode, you will need to execute the following file /bin/ApacheJMeter.jar. This will open the application as the following example.
How to use JMeter?
Now that we have JMeter installed and running, we need to understand the components that are used to create a Test Plan.
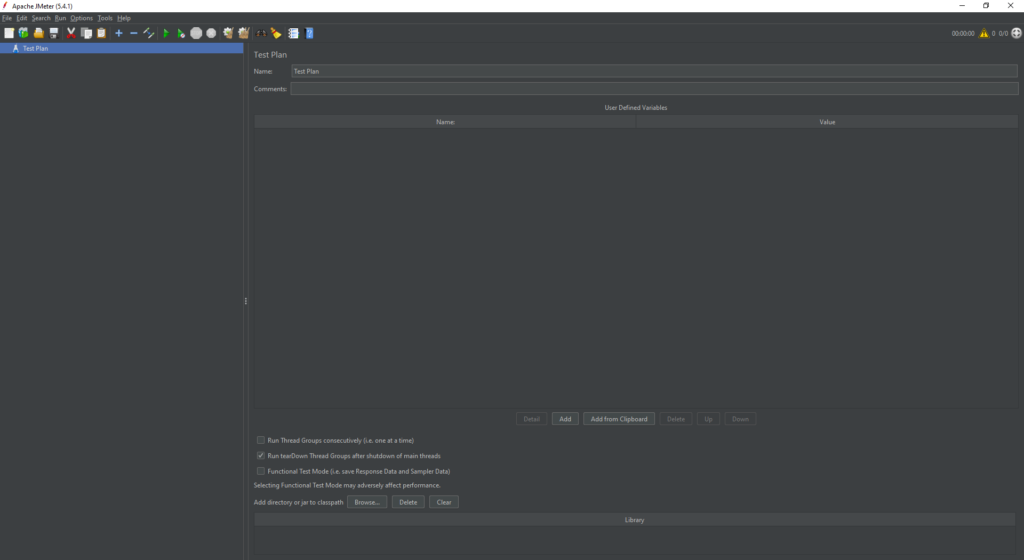
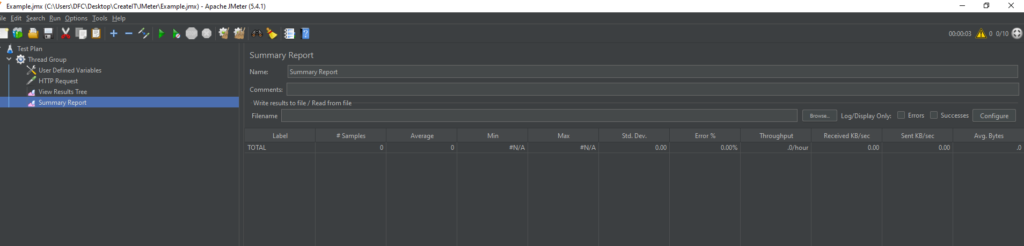
When we open JMeter, we can see that there is already a “Test Plan” component. This component is where we add components for our JMeter Test. Here is an image of how these components are organized.
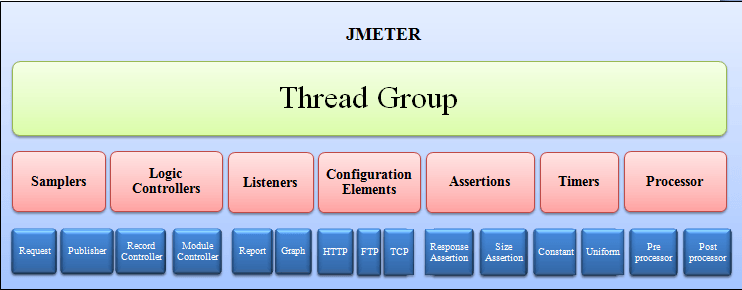
The components that we are gonna talk here will be:
- Thread Group
- Samplers
- Listeners
- Config Elements
Thread Group
Thread group is a collection of threads. This is the component where you define how many threads will run. Essentially, each thread represents a user using the application under test.
The thread group let’s you set the value of threads that you want to run(simulating the number of users, that you to test, using your app).For example, if you set threads number to 100. JMeter will create and make 100 request to the application under test.
Samplers
JMeter supports testing HTTP, FTP, JDBC and many other protocols.
We already know that Thread Groups simulate user request to the server, but how does a Thread Group know which type of requests (HTTP, FTP etc.) it needs to make? The answer is Samplers.
The user request could be FTP Request, HTTP Request, JDBC Request, etc. In this example, we will concentrate in HTTP Request.
Listeners
Listeners shows the results of the test execution. They can show results in a different format such as a tree, table, graph or log file.
Graph result listeners display the server response times on a Graph.
View Result Tree show results of the user request in basic HTML format.
Table Result show summary of a test result in table format.
Log show summary of a test result in the text file.
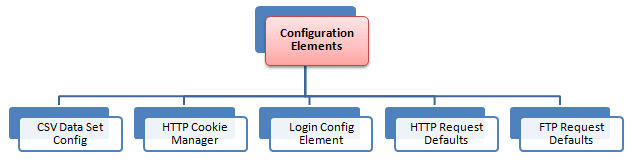
Config Elements
Set up defaults and variables for later use by samplers.
The figure below shows some commonly used configuration elements in JMeter.
Let’s create a test
As was shown before, JMeter starts with a Test Plan Component already created (you can change the name to anything more suitable to your case).
Now let’s start creating our test. In this case we will use https://my-json-server.typicode.com/ to simulate an API.
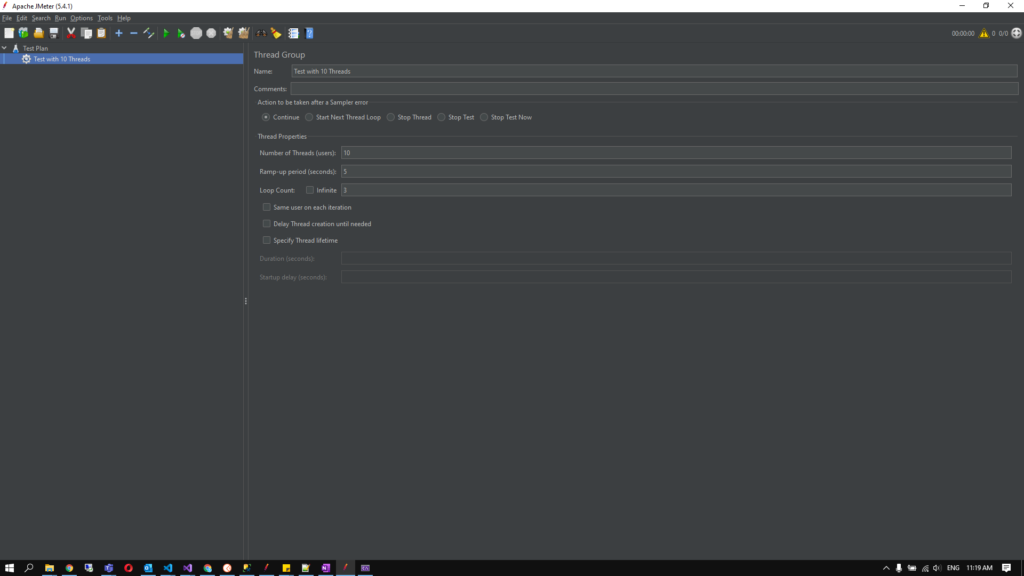
Initially, let’s add a Thread Group. Right click on the test plan, then Add -> Threads(Users) -> Thread Group.
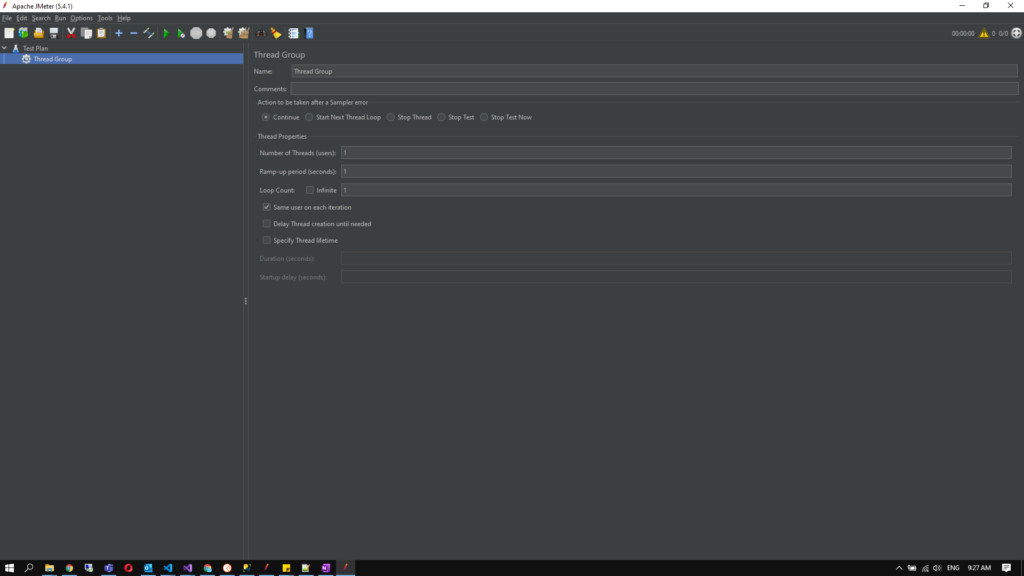
You can see that there is some settings that we need to adjust. At the top, there is a setting that says Action to be taken after a Sampler Error. Normally, I always use this in Continue but you can use the one that suits your case.
The next 3 settings will be the ones that we gonna focus for now.
- Number of Threads (users) – is the number of threads(users) that will be running your test plan.
- Ramp-up period (seconds) – is the value in seconds that defines how much time until all threads are working. Example: 100 Threads and 10 seconds of ramp-up period, this means that the threads will start, gradually, until at the point of 10 seconds all 100 threads will be working.
- Loop Count – You can set this to the Infinite and will only stop threads when you press the button to stop. Also, you can set a loop count, that is the times that each thread will execute the test plan. Example, if you put the value 3, the threads will execute the plan 3 times and then will stop.
So, in our example lets try 10 threads, with 5 seconds of Ramp-up Time and the value 3 in the loop count. I will also change the name of the thread group to know how many threads I am using. It Should look like this.
Let’s continue adding more components. This time, let’s add a way to define variables. Right-click on the Thread Group, then Add -> Config-Element -> User Defined Variables.
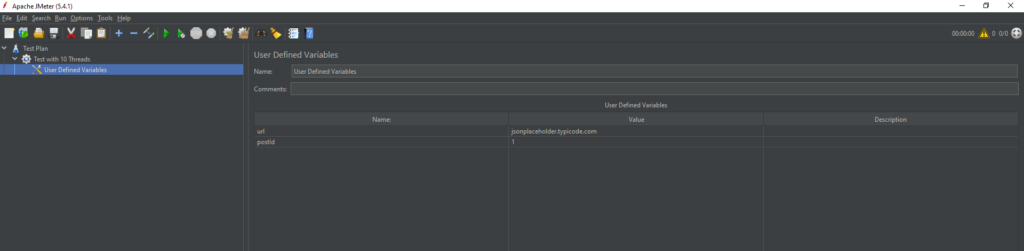
This component will let you define some variable to use afterwards. Let’s define some.
- url: my-json-server.typicode.com
- postId: 1
Now, to use these variables in other components you will need to do it in the following way.
- ${url} for the url Value
- ${postId} for the postId Value
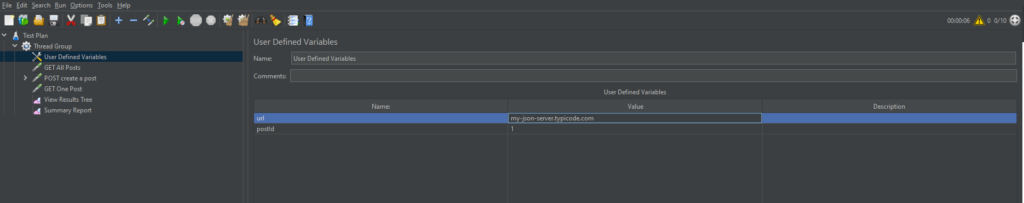
Finally, let’s add some real requests. Here as example we will make 3 different requests. Http Request to get all posts, Http Request to get one Post, and Http Request to Post a new Post. Remember that the site used in this example has paths to request posts and to add posts.
How to add an HTTP Request ? Right-click on the Thread Group, then Add -> Smapler -> Http Request.
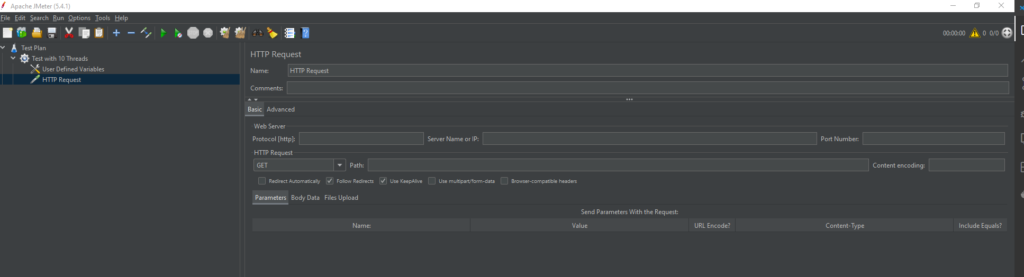
Now that we have an Http Request component, let’s configure to make a Http Request to get all posts. The path to this request is https://jsonplaceholder.typicode.com/posts. The configurations of this component are:
- Protocol -> “https”
- Server Name or IP -> ${url} (because we have this value defined in a variable)
- Port Number -> in this case, nothing but if you need to your specific case, here is where you put the port number. Example: to make a request to https://localhost:80, you would need to put the value 80 in here.
- HTTP Request -> GET
- Path -> “/typicode/demo/posts”
Now that we have everything, let’s run ? Click on the start Button above and see what happens. Nothing ? Stop the process and let’s see what is missing.
The piece that is missing is listeners. We need listeners to understand what is happening. In this case, the View Results Tree and Summary Report. Let’s add these two listeners by Right-clicking in the Thread Group, then Add -> Listener -> View Results Tree and Add -> Listener -> Summary Report.
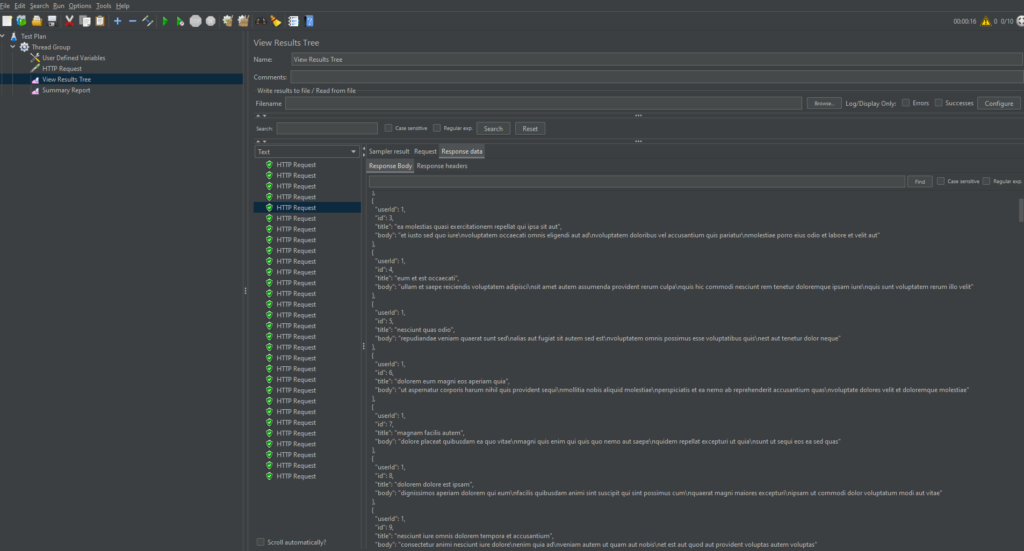
Now, if you start the process, you will see that these listeners represent information about the request.
The View Results Tree show every request information. In here, you can see the request body and headers, and the response body and headers.
In this example, when we choose the Response Body of one request we will see that there will be a JSON with data relative to what they call as posts.
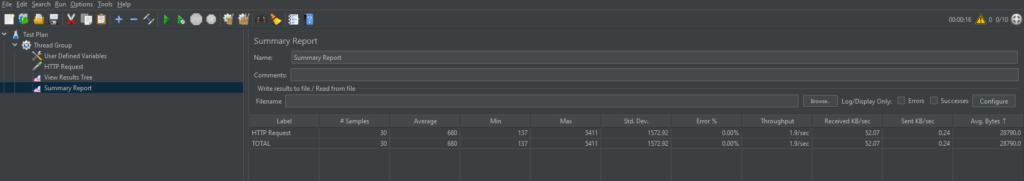
The Summary Report Aggregates the information of different types of request. In this case, we only have one request, so, it will show informations about that request.What are the informations that this will show ?
- #Samples – are the number of requests made
- Average – shows the average time needed to make these requests
- Min – shows the value of the request that take less time to finish
- Max – shows the value of the request that take more time to finish
- Std. Dev. – shows the standard deviation of the request times to the average
- Error % – shows the percentage of requests that failed
- Throughput – shows the number of requests processed by time
- Received KB/sec – shows the amount of data downloaded from the server time
- Sent KB/sec – shows the amount of data uploaded to the server time
- Avg. Bytes – shows the average size of the response sample
We have all we need, let’s add more Requests. Let’s create a request that creates a post, and create a request that obtains only one post. Also, change the name of the Http Request components to now what is the correspondent request. Remember to put the Http Request before the listeners. The Listeners will only listen to what are before them. Remember this!
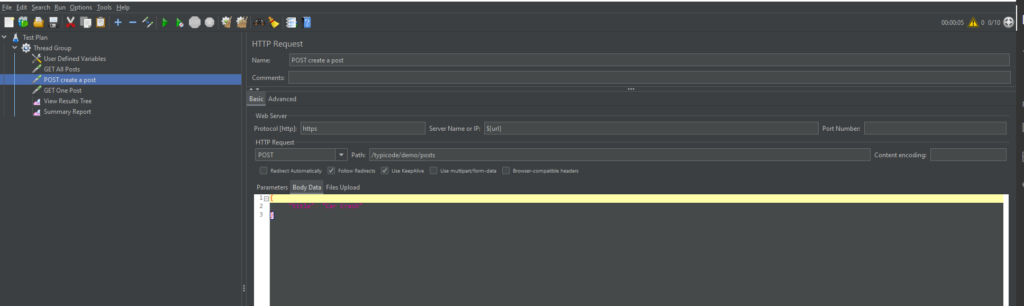
The create a post request configurations are:
- Protocol -> “https”
- Server Name or IP -> ${url} (because we have this value defined in a variable)
- HTTP Request -> Post
- Path -> “/typicode/demo/posts”
- Body Data – we will put a JSON like this {“title”: “Car Crash”}
And, The get one post request configurations are:
- Protocol -> “https”
- Server Name or IP -> ${url} (because we have this value defined in a variable)
- HTTP Request -> Get
- Path -> “/typicode/demo/posts/${postId}”
Run the test plan and see the results. Try to do it for another API.
These are the basic examples that we have for you right now. More advanced tips will come.
See you next time.


