

” or “Access denied”")


 Learning Guide")


 in SharePoint Online Modern Pages")


In this blog post we are going to be showing you can configure Azure Application Insights to send your logs, exceptions and performance metrics from a .NET 6 API.
Installation
Start by installing the Microsoft.ApplicationInsights.AspNetCore nugget package.
Now in your startup class you will need to configure some options for the telemetry collection.
You can use the AddApplicationInsightsTelemetry extension method on the IServiceCollection and pass your options as so:
public class Startup
{
    public virtual void ConfigureServices(IServiceCollection services)
    {
        services.AddApplicationInsightsTelemetry(GetApplicationInsightsServiceOptions());
    }

    private static ApplicationInsightsServiceOptions GetApplicationInsightsServiceOptions()
    {
        return new ApplicationInsightsServiceOptions
        {
            AddAutoCollectedMetricExtractor = false,
            EnableEventCounterCollectionModule = false,
            EnableDiagnosticsTelemetryModule = false,
            EnablePerformanceCounterCollectionModule = true,
            EnableDependencyTrackingTelemetryModule = true,
            EnableRequestTrackingTelemetryModule = false,
            ConnectionString = Configuration[ConfigurationConstants.ApplicationInsightsConnectionString],
        };
    }
}
This is where we define the types of telemetry we want to collect.
The documention of the options are here: https://learn.microsoft.com/en-us/azure/azure-monitor/app/asp-net-core?tabs=netcorenew#use-applicationinsightsserviceoptions
We are also getting the connection string of the application insights resource from our appsettings.
Telemetry modules
Now if we want to go further, we can even specify what metrics to collect for each module.
For instance, let’s say we want to indicate which performance metrics to collect. Then you can do the following:
        services.ConfigureTelemetryModule<PerformanceCollectorModule>((module, applicationInsightsServiceOptions) =>
        {
            module.DefaultCounters.Add(new PerformanceCounterCollectionRequest(@"\Process(??APP_WIN32_PROC??)\Private Bytes", @"\Process(??APP_WIN32_PROC??)\Private Bytes"));
            module.DefaultCounters.Add(new PerformanceCounterCollectionRequest(@"\Process(??APP_WIN32_PROC??)\% Processor Time", @"\Process(??APP_WIN32_PROC??)\% Processor Time"));
        });
You can view the documentation on configuring telemetry modules here: https://learn.microsoft.com/en-us/azure/azure-monitor/app/asp-net-core?tabs=netcorenew#configure-or-remove-default-telemetrymodules
Extensibility
To add or remove properties from collected telemetry (before it gets sent to Azure) you can create classes that implement the ITelemetryInitializer class from the Azure Application Insights SDK (https://learn.microsoft.com/en-us/azure/azure-monitor/app/asp-net-core?tabs=netcorenew#add-telemetryinitializers).
A classic example for a telemetry initializer is a correlation id initializer. You would get a correlation id from your http request and pass it to all telemetry so that you can have a nice trace of everything that went through your system:
public class CorrelationIdInitializer : ITelemetryInitializer
{
    private readonly IHttpContextAccessor _httpContextAccessor;
    private const string CorrelationIdProperty = "CorrelationId";

    public CorrelationIdInitializer(IHttpContextAccessor httpContextAccessor)
    {
        _httpContextAccessor = httpContextAccessor;
    }

    public void Initialize(ITelemetry telemetry)
    {
        ISupportProperties telemetryProperties = (ISupportProperties)telemetry;

        // This is just an extension method where you would extract the correlation id from the request headers according to your header name.
        string correlationId = _httpContextAccessor.HttpContext.GetCorrelationId();

        if (!string.IsNullOrWhiteSpace(correlationId) && !telemetryProperties.Properties.ContainsKey(CorrelationIdProperty))
        {
            telemetryProperties.Properties.Add(CorrelationIdProperty, correlationId);
        }
    }
To register the telemetry initializer, simply register the class and its respective interface (always ITelemetryInitializer) on your service collection: services.AddSingleton<ITelemetryInitializer, CorrelationIdInitializer>();
Filtering
Additionally, you also have the ability to filter out telemetry from being collected. This is a great feature that allows you to focus only storing what you really care about and will save you a LOT of costs.
Do keep in mind that filtering out telemetry does mean that you won’t be able to query it and therefore can make your tracing a bit difficult.
This is all related to telemetry processors (https://learn.microsoft.com/en-us/azure/azure-monitor/app/asp-net-core?tabs=netcorenew#add-telemetry-processors).
Imagine you have thousands of fast dependencies (see the list of automatically tracked dependencies https://learn.microsoft.com/en-us/azure/azure-monitor/app/asp-net-dependencies#automatically-tracked-dependencies) that are being stored by your system but you come to a conclusion that they only make it hard to monitor your system and you don’t really need them.
Filtering them out is the way to go OR you could consider sampling instead https://learn.microsoft.com/en-us/azure/azure-monitor/app/asp-net-core?tabs=netcorenew#sampling.
Lets create a processor that filters out successful dependencies that had a duration under 500 milliseconds:
public class FastDependencyProcessor : ITelemetryProcessor
{
    private ITelemetryProcessor Next { get; set; }

    public FastDependencyProcessor(ITelemetryProcessor next)
    {
        Next = next;
    }

    public void Process(ITelemetry item)
    {
        if (!ShouldFilterTelemetry(item))
        {
            Next.Process(item);
        }
    }

    public bool ShouldFilterTelemetry(ITelemetry item)
    {
        bool shouldFilterTelemetry = false;

        DependencyTelemetry dependency = item as DependencyTelemetry;

        if (dependency != null
            && dependency.Duration.TotalMilliseconds < 500
            && dependency.Success.HasValue && dependency.Success.Value)
        {
            shouldFilterTelemetry = true;
        }

        return shouldFilterTelemetry;
    }
}
After creating the class, you have to register the telemetry processor as part of your service collection like so:
services.AddApplicationInsightsTelemetryProcessor<FastDependencyProcessor>();
Keep in mind that if your telemetry processors will be executed in the order in which you’ve called them in your register process.
Final notes
– Azure Application Insights is a great tool that gives you visibility on how your application is doing.
You can use the SDK to collect most telemetry automatically or you could even instrument specific scenarios manually by making use of the TelemetryClient instance (https://learn.microsoft.com/en-us/azure/azure-monitor/app/asp-net-core?tabs=netcorenew#how-can-i-track-telemetry-thats-not-automatically-collected).
– It is important to monitor your costs as it is easy to end up storing everything and not only what you need. So start by defining what you need to collect and what metrics will be relevant for you.
Then you can filter out the irrelevant data and from there on you could even create alerts from the data you collect, using Azure Monitor.
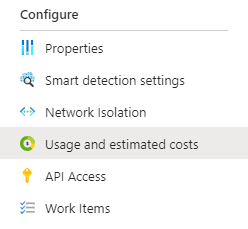
If you are trying out Application Insights on a test environment, you can even set a daily cap of X GB so that you control your spending. Simply navigate to the Azure Application Insights resource through the Azure Portal and click “Usage and estimated Costs” on the sidebar:

– From what I’ve seen so far, the collection of dependencies/exceptions can represent the majority of costs as you may have a lot of dependencies flowing through your system and because exceptions are a type of telemetry that occupies a lot of space. Filtering out irrelevant dependencies will definitely help.
As for exceptions, you may consider using the Result pattern instead of using exceptions for the normal control flow of your code. This also has the advantage of decreasing the impact on performance lead by exceptions to your application since you reduce the amount of exceptions thrown.


")